【Mathematica】用ComplexPlot绘制辐角图
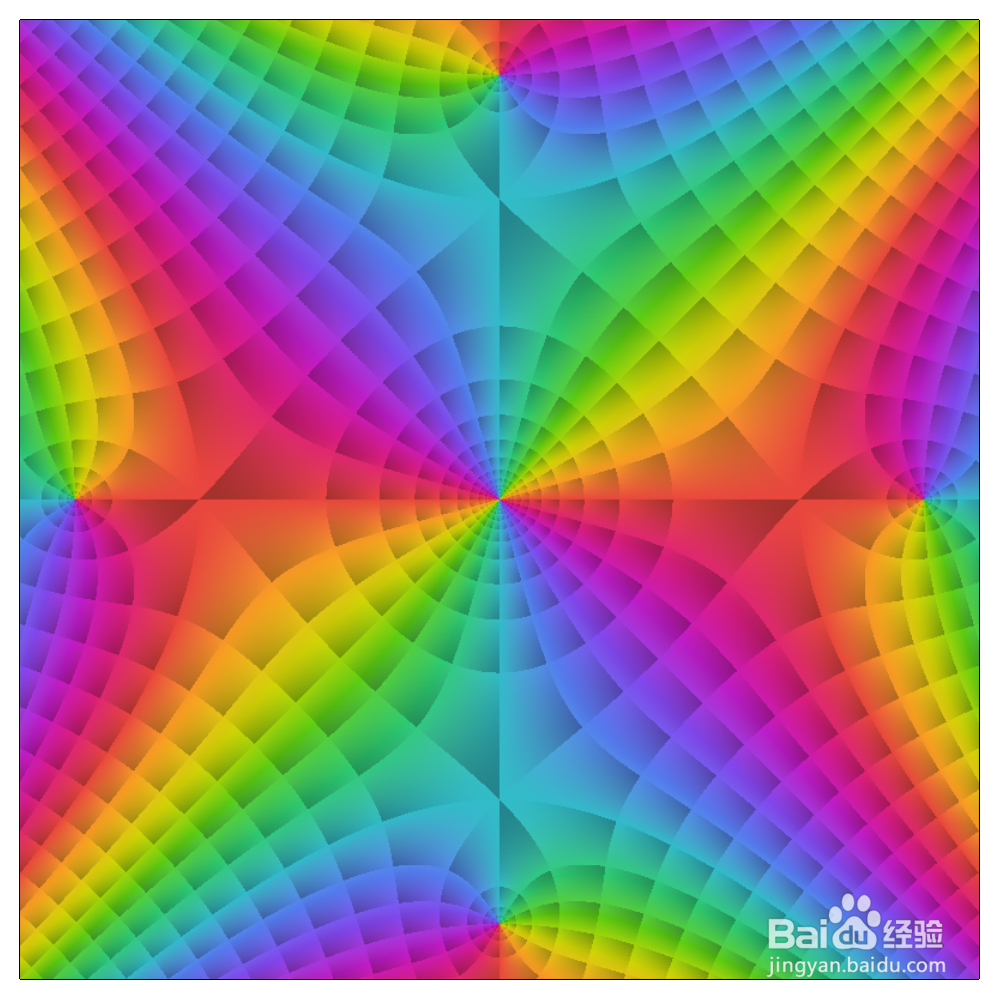
1、Image[ComplexPlot[Sin[3z], {z, -2 - 2 I, 2 + 2 I},ColorFunction -> "Cycli艘早祓胂cLogAbsArg",PlotPoints->300,Frame->False,ImageSize->1000]]绘制函数Sin[3z]的辐角图,并使用色调来凸显函数的特征。

2、Sin[3z]比Sin[z],只是画图范围变大了而已:

3、Sin[z^2]:
4、Sin[z^6]:

5、(Sin[z]+1)/(Sin[z]-1):

6、Sin[z^3]+1)/(Sin[z]-1):

7、Sin[1+z+z^2]:

8、Log[2z]:

9、(3z)^(3z):

声明:本网站引用、摘录或转载内容仅供网站访问者交流或参考,不代表本站立场,如存在版权或非法内容,请联系站长删除,联系邮箱:site.kefu@qq.com。