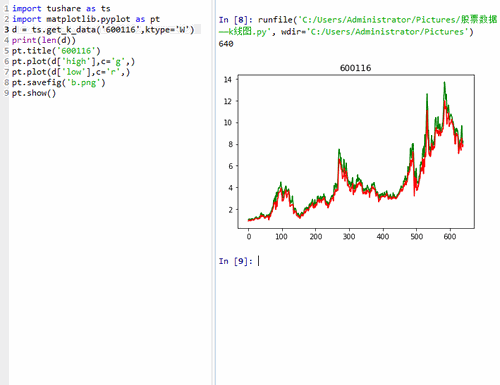
用python读取股票k线图的方法
1、读取某个股票的日k线图:d = ts.get_k_data('code',ktype='D')

2、绿色是最高价k线图,红色线是最低价k线图。

3、月k线图:d = ts.get_k_data('600116',ktype='M')


4、周k线图:d = ts.get_k_data('600116',ktype='W')

5、600000的月k线图:d = ts.get_k_data(a,ktype='M')


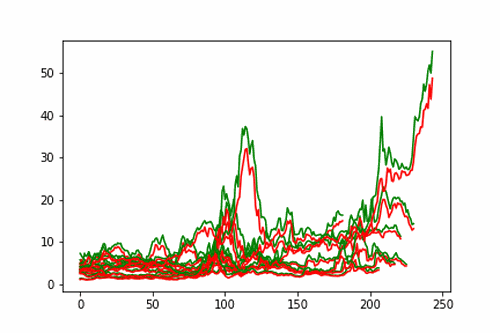
6、多只股票的月k线图:for i in range(600000,600010): d = ts.get_k_data(str(i),ktype='M')

声明:本网站引用、摘录或转载内容仅供网站访问者交流或参考,不代表本站立场,如存在版权或非法内容,请联系站长删除,联系邮箱:site.kefu@qq.com。