R 软件如何绘制热力图?
1、运行环境RStudio。打开数据集,这里以txhousing数据为例,选取city、year、sales三列数据。


2、设置基层图。fill设置为sales,sales值越大热度越高。
library(ggplot2)
p<-ggplot(data=txhousing,aes(x=year,y=city,fill=sales))

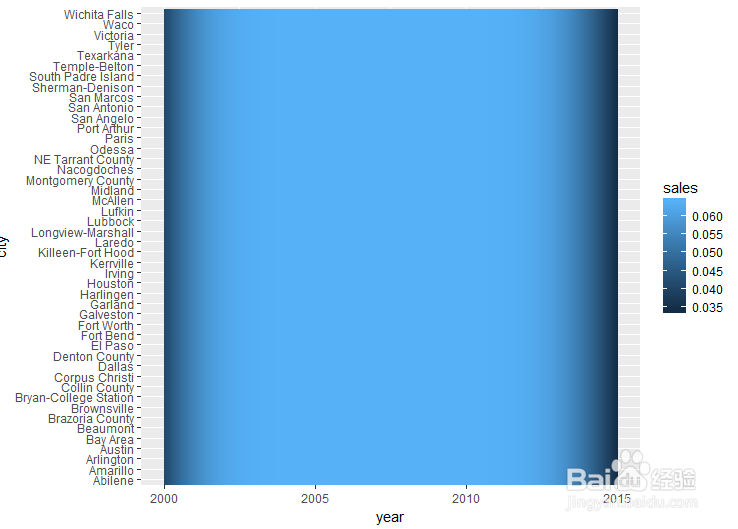
3、绘制热力图。直接加geom_tile。
p+geom_tile()

4、geom_raster也可以达到相同的效果,设置参数interpolate = TRUE。
geom_raster(aes(fill = density), interpolate = TRUE)

5、设置参数fill = density。
p+ stat_density(aes(fill = ..density..), geom = "raster", position = "identity")
6、添加参数binwidth = c(0.01,0.01)。
p+geom_raster()+stat_bin2d(binwidth = c(0.01,0.01),colour="grey")
可以根据实际需要进行设置。

声明:本网站引用、摘录或转载内容仅供网站访问者交流或参考,不代表本站立场,如存在版权或非法内容,请联系站长删除,联系邮箱:site.kefu@qq.com。
阅读量:87
阅读量:20
阅读量:172
阅读量:172
阅读量:171