D3.js实现复杂信息图表
1、新建html文档。

2、准备好需要用到的表格。

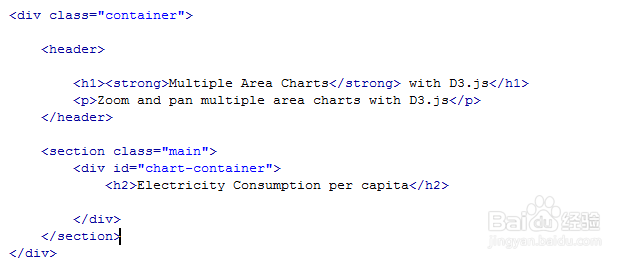
3、书写hmtl代码。 <div class="container"> <header> <h1><strong>Multiple Area Charts</strong> with D3.js</h1> Zoom and pan multiple area charts with D3.js </header> <section class="main"> <div id="chart-container"> <h2>Electricity Consumption per capita</h2> </div> </section> </div>
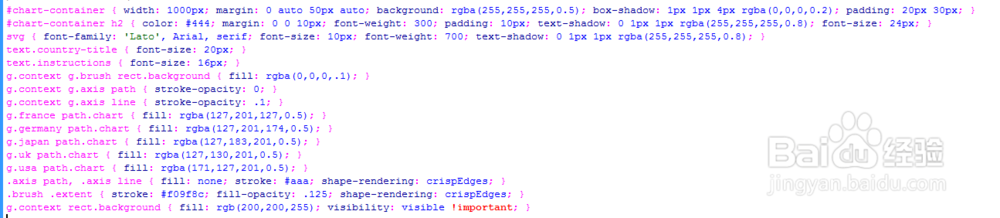
4、书写css代码。#chart-container { width: 1000px; margin: 0 auto 50px auto; background: rgba(255,255,255,0.5); box-shadow: 1px 1px 4px rgba(0,0,0,0.2); padding: 20px 30px; }#chart-container h2 { color: #444; margin: 0 0 10px; font-weight: 300; padding: 10px; text-shadow: 0 1px 1px rgba(255,255,255,0.8); font-size: 24px; }svg { font-family: 'Lato', Arial, serif; font-size: 10px; font-weight: 700; text-shadow: 0 1px 1px rgba(255,255,255,0.8); }text.country-title { font-size: 20px; }text.instructions { font-size: 16px; }g.context g.brush rect.background { fill: rgba(0,0,0,.1); }g.context g.axis path { stroke-opacity: 0; }g.context g.axis line { stroke-opacity: .1; }g.france path.chart { fill: rgba(127,201,127,0.5); }g.germany path.chart { fill: rgba(127,201,174,0.5); }g.japan path.chart { fill: rgba(127,183,201,0.5); }g.uk path.chart { fill: rgba(127,130,201,0.5); }g.usa path.chart { fill: rgba(171,127,201,0.5); }.axis path, .axis line { fill: none; stroke: #aaa; shape-rendering: crispEdges; }.brush .extent { stroke: #f09f8c; fill-opacity: .125; shape-rendering: crispEdges; }g.context rect.background { fill: rgb(200,200,255); visibility: visible !important; }
5、书写并添加js代码。 <script> var margin = {top: 10, right: 40, bottom: 150, left: 60}, width = 940 - margin.left - margin.right, height = 500 - margin.top - margin.bottom, contextHeight = 50; contextWidth = width * .5; var svg = d3.select("#chart-container").append("svg") .attr("width", width + margin.left + margin.right) .attr("height", (height + margin.top + margin.bottom)); d3.csv('data.csv', createChart); function createChart(data){ var countries = []; var charts = []; var maxDataPoint = 0; for (var prop in data[0]) { if (data[0].hasOwnProperty(prop)) { if (prop != 'Year') { countries.push(prop); s',this.name.toLowerCase()) .attr("transform", "translate(" + this.margin.left + "," + (this.margin.top + (this.height * this.id) + (10 * this.id)) + ")"); this.chartContainer.append("path") .data([this.chartData]) .attr("class", "chart") .attr("clip-path", "url(#clip-" + this.id + ")") .attr("d", this.area); this.xAxisTop = d3.svg.axis().scale(this.xScale).orient("bottom"); this.xAxisBottom = d3.svg.axis().scale(this.xScale).orient("top"); if(this.id == 0){ this.chartContainer.append("g") .attr("class", "x axis top") .attr("transform", "translate(0,0)") .call(this.xAxisTop); } if(this.showBottomAxis){ this.chartContainer.append("g") .attr("class", "x axis bottom") .attr("transform", "translate(0," + this.height + ")") .call(this.xAxisBottom); } this.yAxis = d3.svg.axis().scale(this.yScale).orient("left").ticks(5); this.chartContainer.append("g") .attr("class", "y axis") .attr("transform", "translate(-15,0)") .call(this.yAxis); this.chartContainer.append("text") .attr("class","country-title") .attr("transform", "translate(15,40)") .text(this.name); } Chart.prototype.showOnly = function(b){ this.xScale.domain(b); this.chartContainer.select("path").data([this.chartData]).attr("d", this.area); this.chartContainer.select(".x.axis.top").call(this.xAxisTop); this.chartContainer.select(".x.axis.bottom").call(this.xAxisBottom); } </script>

6、代码整体结构。

7、查看效果。