用Maple绘制非隐函数图像
1、绘制参数方程,需要把各参数放在中括号里面:[cos(t), sin(t), t = 0 .. 2*Pi]
2、绘制极坐标方程:with(plots);polarplot(sin(5*t), t = 0 .. 20*Pi, thickness = 3, scaling = constrained);
3、绘制二元显函数的图像:plot3d(x^2+y^2, x=-2..2, y=-2..2);
4、绘制一元显函数图像:plot(x^3, x = -2 .. 2)
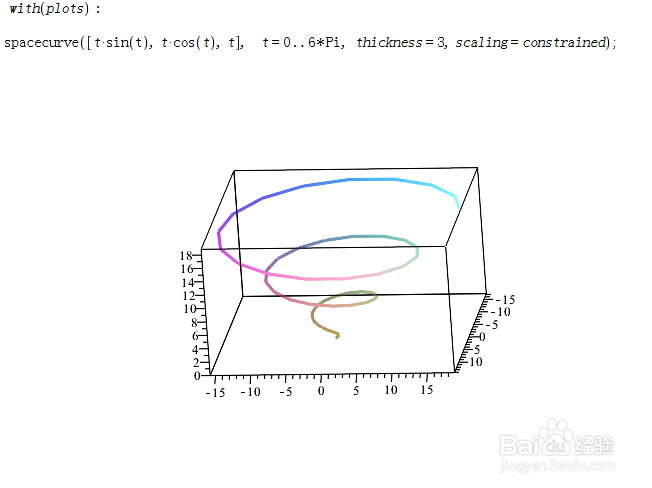
5、绘制空间参数方程曲线:spacecurve([t*衡痕贤伎sin(t), t*cos(t), t], t = 0 .. 6*Pi)
声明:本网站引用、摘录或转载内容仅供网站访问者交流或参考,不代表本站立场,如存在版权或非法内容,请联系站长删除,联系邮箱:site.kefu@qq.com。
阅读量:92
阅读量:44
阅读量:22
阅读量:41
阅读量:59


