Mathematica基础——ContourPlot的选项
1、 AspectRatio指定图形的高度与宽度的比值。
ContourPlot[Cos[x] + Cos[y] == 0, {x, 0, 4 Pi}, {y, 0, 4 Pi},
AspectRatio -> 2]
上面代码表示高宽比值为2:1.
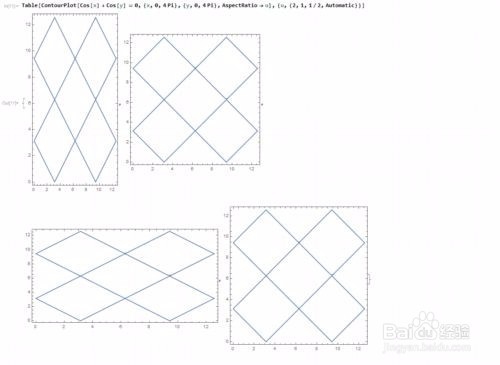
我们一般情况下,要获得实际比例的高宽比值,可以用AspectRatio -> Automatic来指定:
Table[ContourPlot[Cos[x] + Cos[y] == 0, {x, 0, 4 Pi}, {y, 0, 4 Pi},
AspectRatio -> u], {u, {2, 1, 1/2, Automatic}}]
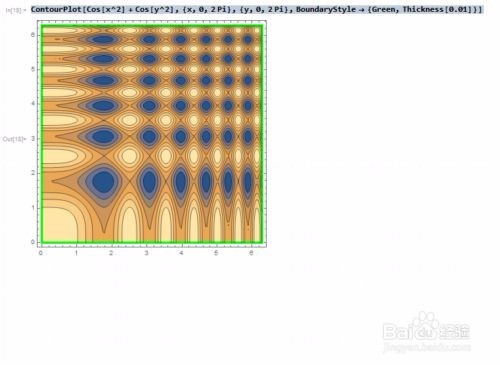
2、用BoundaryStyle来界定整个图形的边界的样式:
ContourPlot[Cos[x^2] + Cos[y^2], {x, 0, 2 Pi}, {y, 0, 2 Pi},
BoundaryStyle -> {Green, Thickness[0.01]}]
边界是绿色的线,粗细程度是0.01.
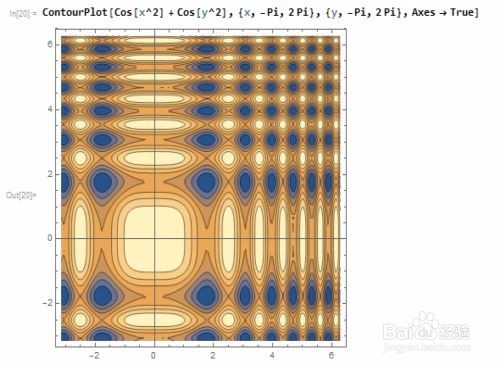
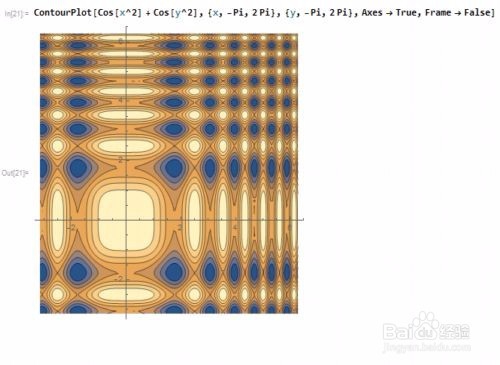
3、用Axes指定是否显示坐标轴!但是,在有边框(Frame->True)和无边框(Frame->False)的时候,有一点小区别,大家仔细看:
ContourPlot[Cos[x^2] + Cos[y^2], {x, -Pi, 2 Pi}, {y, -Pi, 2 Pi},
Axes -> True, Frame -> False]
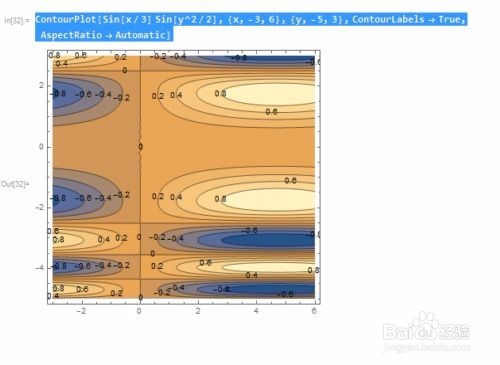
4、用ContourLabels -> True来为所绘制的等高线加上标签!而这些标签,就是等高线的数值。
ContourPlot[Sin[x/3] Sin[y^2/2], {x, -3, 6}, {y, -5, 3},
ContourLabels -> True, AspectRatio -> Automatic]
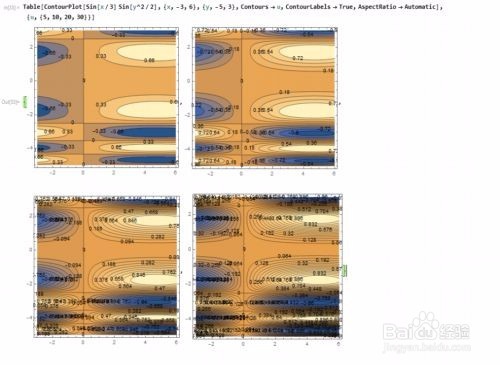
5、用Contours -> u来指定等高线的密度,这里,u的值分别是5、10、20、30,u越大,等高线越密集!
Table[ContourPlot[Sin[x/3] Sin[y^2/2], {x, -3, 6}, {y, -5, 3},
Contours -> u, ContourLabels -> True,
AspectRatio -> Automatic], {u, {5, 10, 20, 30}}]