python如何在matplotlib中绘制图例legend?
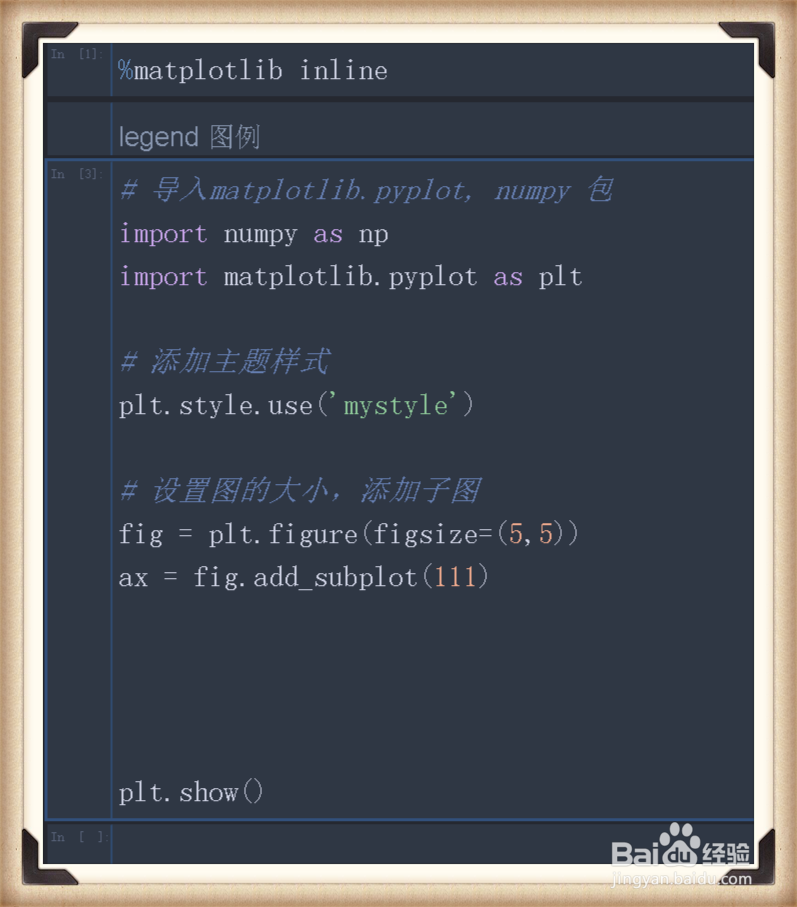
1、首先导入使用到的包,matplotlib.pyplot, numpy:

2、接着设置图的大小,添加子图,figsize用于设置图的大小:
3、再接着,我们使用numpy创建正弦,余弦曲线的点集合,并调用plot方法绘制:

4、然后,我们只需要一行代码,plt.legend(loc='位置'), 把图例加上了:

5、但是,我们可能满足于这种显示方式,我想要把图例单独单个显示,拆分出来,这里重要的代码就是,获取到legend ,调用add_artist方法,不然会被覆盖掉,到此,legend图例的操作完成了。

6、一个好看的图例:

声明:本网站引用、摘录或转载内容仅供网站访问者交流或参考,不代表本站立场,如存在版权或非法内容,请联系站长删除,联系邮箱:site.kefu@qq.com。
阅读量:87
阅读量:23
阅读量:21
阅读量:85
阅读量:81