SAP PSI Production planning flow chart
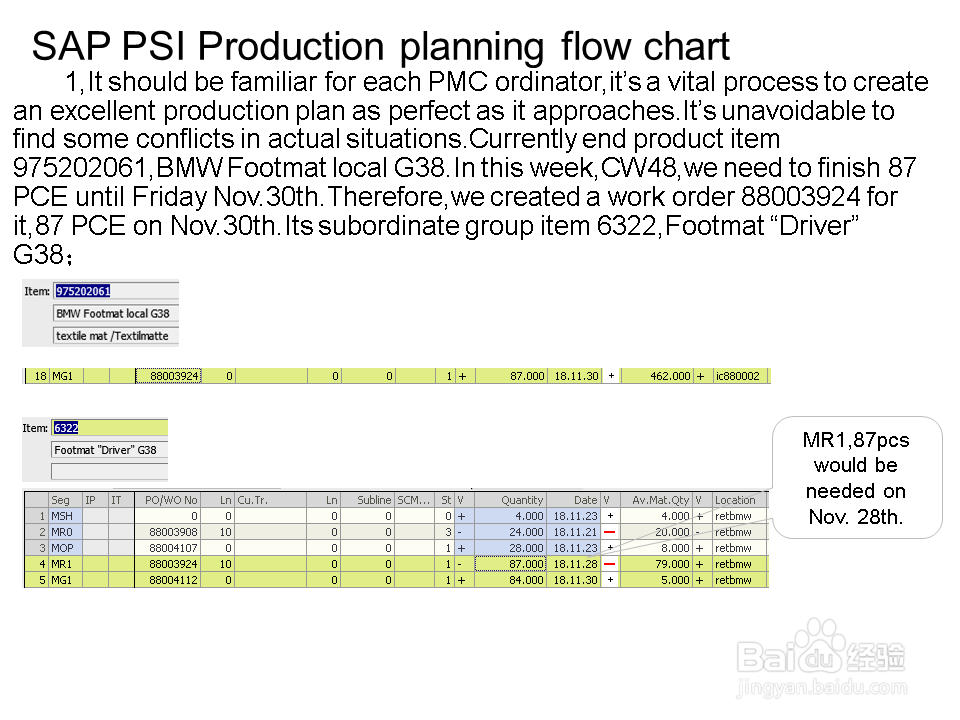
1、Currently end product item 975202061,BMW Footmat local G38.In this week,CW48,we need to finish 87 PCE until Friday Nov.30th.Therefore,we created a work order 88003924 for it,87 PCE on Nov.30th.Its subordinate group item 6322,Footmat “Driver” G38;

2、The lead time of producing for 975202061 is 2.18 working days.Then the system created its requiring date for 6322 on Nov.28th.Obviously,we’re not able to cover it in actual status.Why does it happen?

3、Hence shall we need to create daily working orders into Penta?On one hand,more manual operations would be generated,on the other hand,it shall make the data in system become more complicated and enormous;

4、The routine step run time created in PSI were not so accurate as actual status;

5、In QlikView,the diagraph had been much deviated to actual status;
